
Get insights on budget allocation between Google UAC, Meta, and TikTok for app campaigns.
Brainstorm meeting with sketches of user personas and messaging pillars.
Brainstorm meeting with sketches of user personas and messaging pillars.
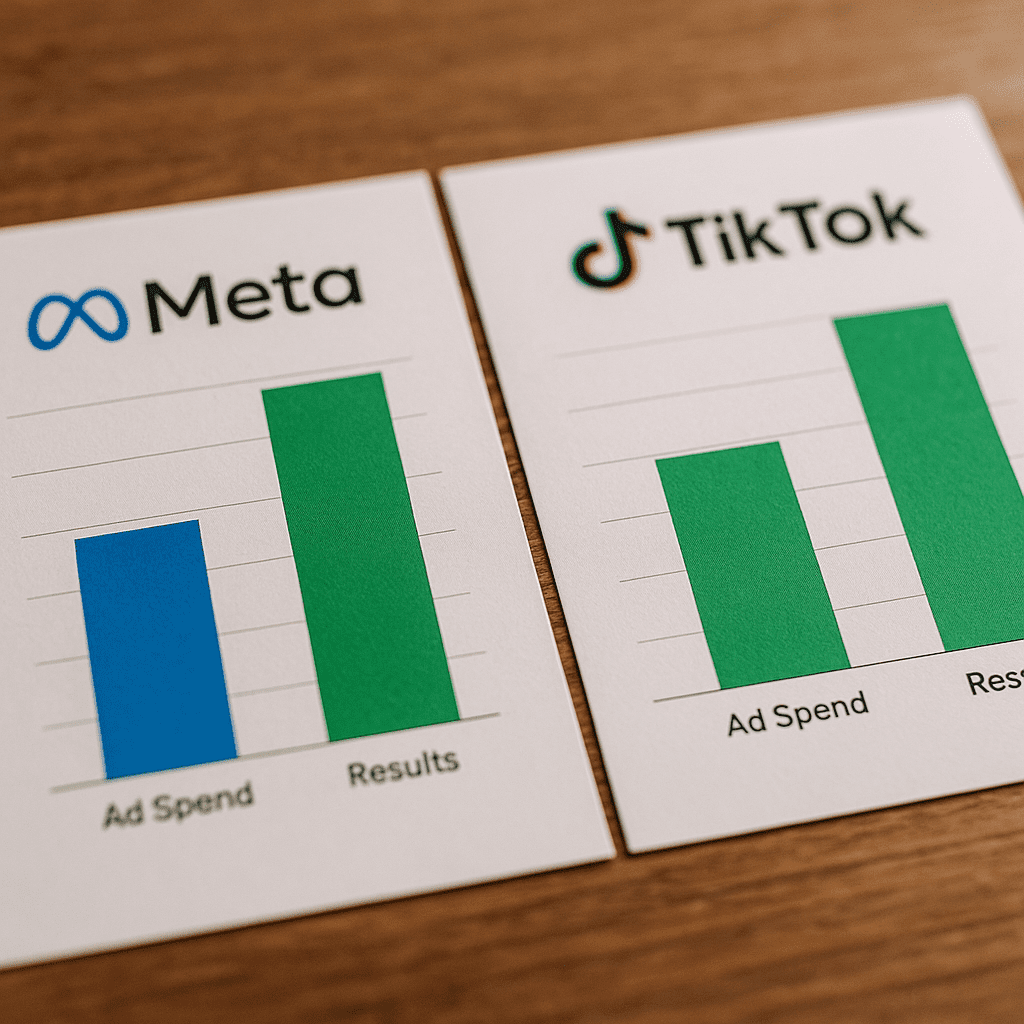
Side-by-side breakdown of Meta vs TikTok ad spend and results charts.
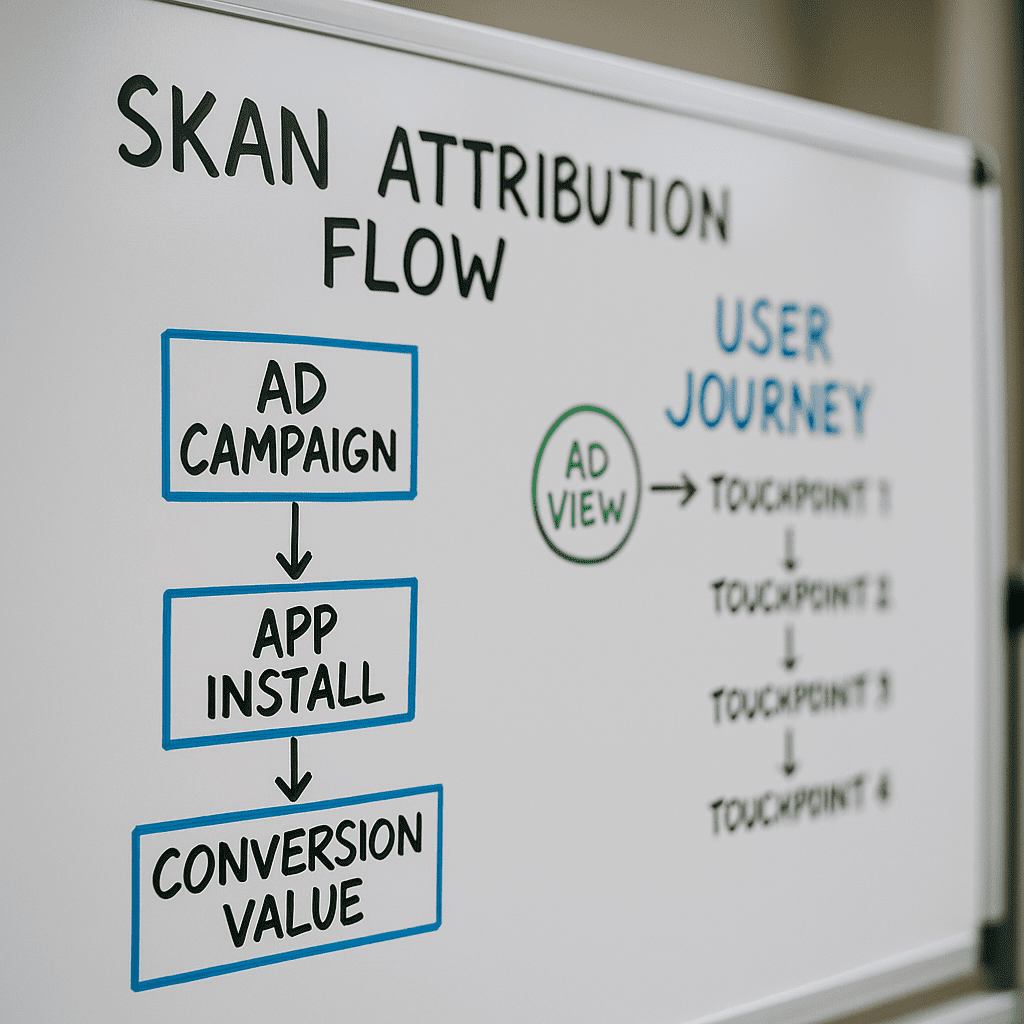
Whiteboard session mapping out SKAN attribution flow and user journey touchpoints.
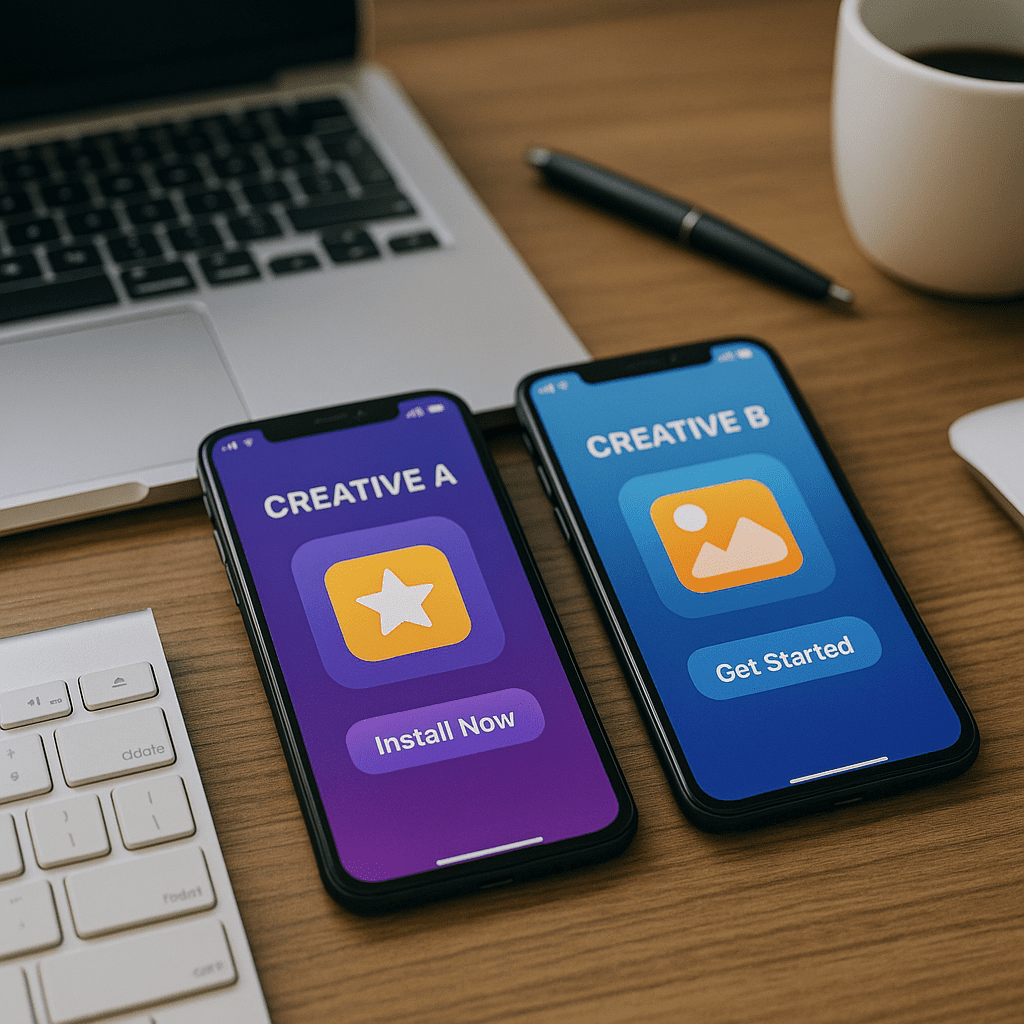
Workspace setup with mobile devices running A/B tested creatives side by side.

Creative team analyzing ad performance using heatmaps and engagement data.

UX designer testing app interfaces and store visuals for conversion impact.

A global map with app icons and country-specific metrics.

Design team reviewing mobile-optimized landing page wireframes.

Marketers aligning CRM workflows with paid UA dashboards.
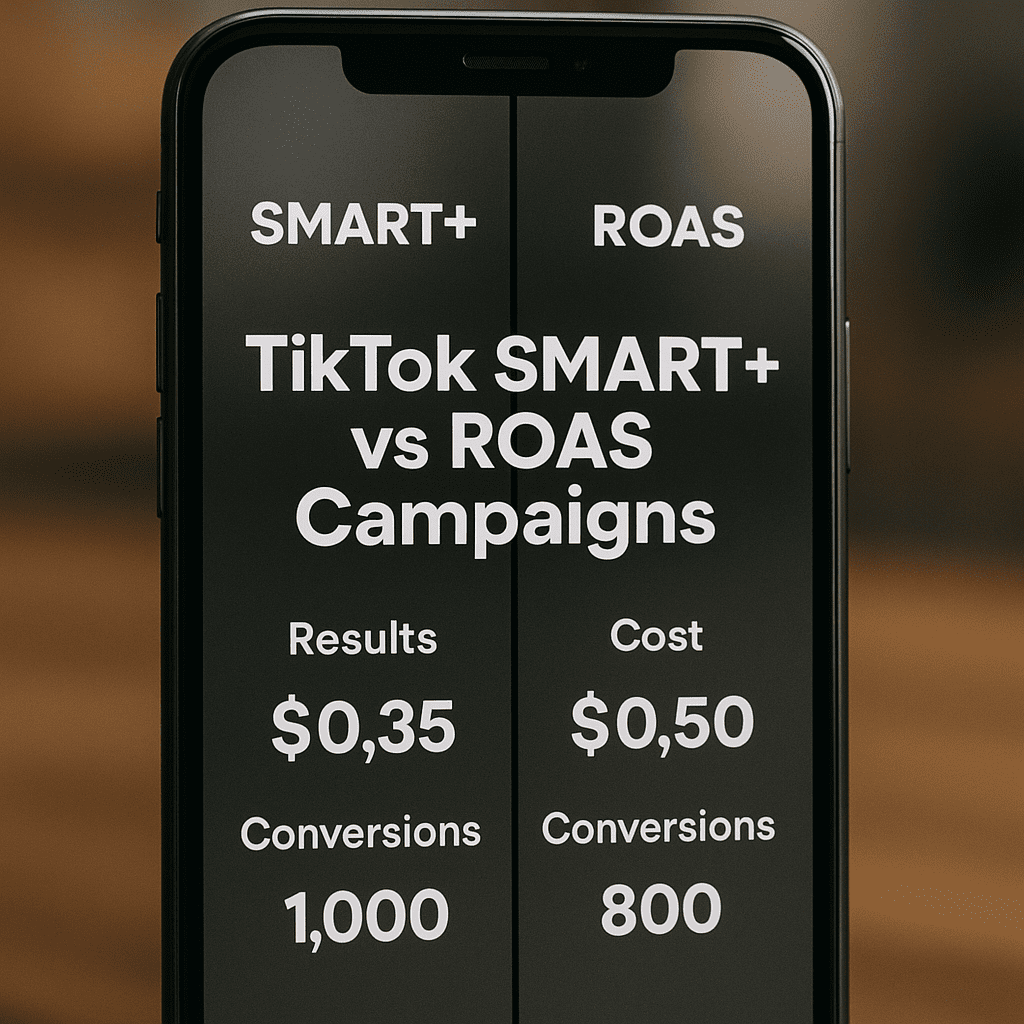
Split-screen visuals comparing SMART+ and ROAS TikTok ad results.